|
|||
| You are here: Home ... Case Studies ... ICT | |||
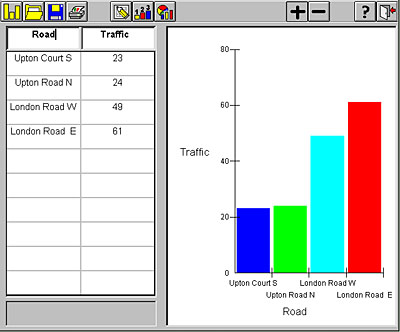
ICT KS1 (Y2) : Traffic Survey Activity Description The pupils took part in a survey exploring the density and movement of traffic on different roads around the school. The survey took place in the morning. They then used a graphing program to investigate traffic flow. The teachers reminded the pupils how to use a tally chart to record their observations. Groups of pupils undertook surveys, noting down the numbers of vehicles travelling in each direction along a road. Back in class, the teacher demonstrated how to enter data into a graph-drawing program. The class looked at different types of graphs available in the program and agreed that the bar chart was the best way to present their data. Later, pairs of pupils entered their data into the program to produce charts. As a group, the class discussed their findings and noted that the west to east road was the busiest, with more cars travelling towards London. The road going north to south was less busy. For homework, the teacher asked the class to think of reasons why. She asked them to think about what the pattern might be if they took their survey in the late afternoon. Activity Objectives
Commentary: Using ICT In this example, Emma has collected data using a tally chart and entered the data into a graphing program. She has combined data collected directly with data from another pupil's survey of a different road. She has used the software to create a graph showing the comparison between the frequency of traffic on two roads. Emma has printed the graph and used it to answer questions set by the teacher. She has identified the busiest road, giving reasons why this might be the case. This example illustrates aspects of work at level 2. Emma uses ICT purposefully to organise data and present her findings. To make further progress, Emma might be given opportunities to collect, organise and investigate information by creating a straightforward database.
Emily's tally chart This case study is taken from the NC Action website |
|||